How to Calculate the ROI of UX

If you’re leading a UX Design team, chances are, you probably don’t sit down very often to calculate the ROI of your team’s work. Whether you track the ROI of UX or not, resource allocation and the prominence of your team likely depend on your ability to tie your work back to business objectives. Although it might take some work to identify it, the ROI of UX is always positive for your organization.
What do we mean by the ROI of UX?
As the Interaction Design Foundation explains, the specific challenge with measuring the ROI of UX is that the investment is usually not measured in the same unit as the benefit, and the benefit is not always direct or measurable.
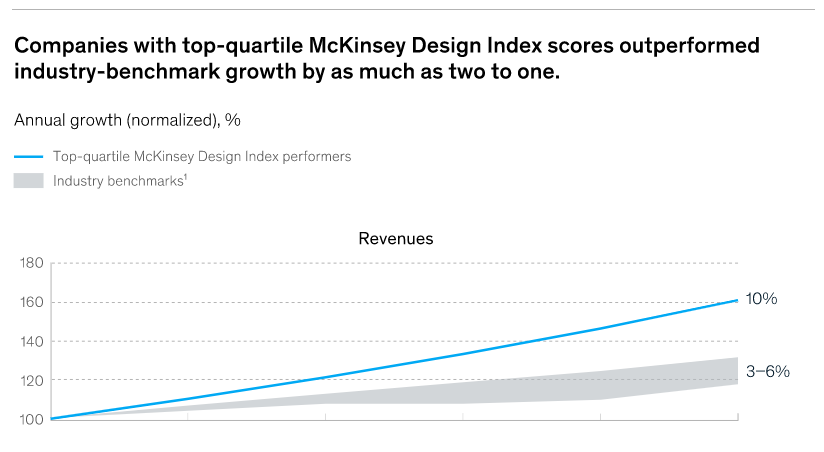
It’s well documented that every $1 invested in UX returns $100 to the business. Furthermore, software development experts estimate that every $1 invested during the design stage of software development actually saves $100 later. Improvements in design are not specific to an industry or brand. Consider:
- Bank of America saw a 45% increase in online banking registration after a UX redesign
- Wal-Mart web traffic increased more than 200% after their UX redesign
- AirBnB’s founder, Joe Gebbia attributes their $30 billion growth to their investment in UX
- Hubspot saw a 300% improvement in their conversion rate after a UX project
Put simply, companies that invest in design perform better on virtually all criteria.
But, how do UX and design practitioners measure the ROI of their specific work in terms of their specific leadership values?
The energy and effort to actually draw the line connecting your specific work to financial outcomes seems daunting, but it doesn’t have to be.
How do we measure the ROI of UX?
You’re confident your team’s UX improvements will deliver more positive product reviews, higher brand loyalty, reduced user errors, and better conversion rates. You inherently know good design functions better, and you likely have basic data to support that your improvements lead to an indirect increase in profits.
Calculating the ROI of UX allows you to identify a direct correlation to your team’s action and project budget to increase sales or revenue your finance and business leaders are concerned about.
So how do you measure this? Start with what your business leaders care about most.
Step 1: Speak the language of the business
In our day-to-day, designers and developers speak in terms of “sprints,” “experiences,” and “journeys.” The first step is to adjust your terminology to the language of the business. Start with a list of the most important KPIs that finance and sales track (or whatever is most important to your key stakeholder).
Different organizations emphasize slightly different KPIs depending on their sector, stage of development, and priorities, but here are some common examples:
- Revenue and Cost (Profit Margin)
- Customer Lifetime Value (CLV)
- Employee-Turnover Rate (ETR)
- Employee Productivity (time on task, task completions per day, etc.)
- Donors and donor growth (non-profits)
- NPS scores
- Churn rate
Which of these KPIs are (or could be) used persuasively to measure value and justify your project to the rest of the organization? Which KPIs are closest to the work your team impacts?
Step 2: Be SMART about your activity toward results
In order to measure ROI, you need a specific and measurable goal that will define success for your team or for a project. You want this goal to connect as seamlessly as possible to one of the KPIs on your short list from Step 1.
In defining success, you want to stick to SMART goals:
S=Specific M=Measurable A=Achievable R=Relevant T=Time-Bound
Through usability testing, you’re confident the ecommerce site optimizations can have a direct impact on sales revenue for a specific line of business over the next year. So, one of your SMART goals could be stated like this:
“We expect to increase sales revenue for XYZ line of business (Specific) by 20% (Measurable) before the end of the next fiscal year (Time-Bound).”
Since this is tied to a core business KPI, you know it’s Relevant. You and your team then need to honestly assess whether you believe it’s Achievable.
Often, these goals are handed to you as part of a larger effort across departments. You can also create multiple goals for yourself that fit into a larger company-wide goal. The key is to make these something you and your whole team can keep in front of you as a guide to lead you through your work.
Step 3: Keep score to help you calculate the ROI of UX
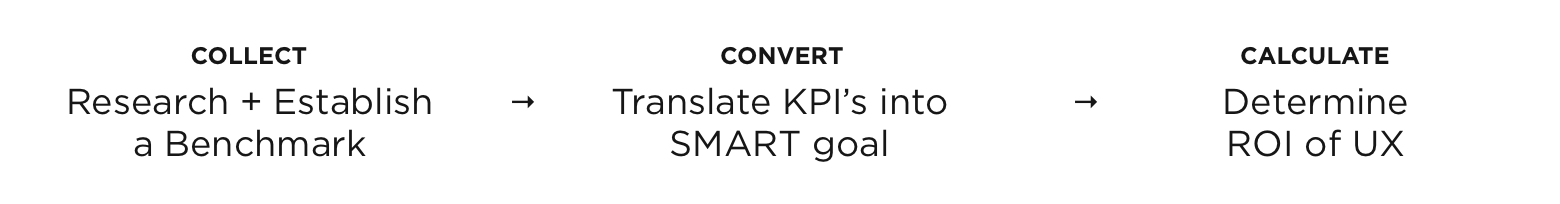
Now that you’ve identified what’s most important to the business and what your team can do to impact those core KPIs, it’s time to collect your data, convert it to metrics you can affect, and calculate your ROI.
No matter where you are in your journey to UX Maturity, you’re already collecting some level of UX metrics. Whether you’re using Google Analytics, customer surveys, sales funnel tracking, internal customer service metrics, or some combination of all of these or more, there’s something you’re using to tell the story of your team’s contribution. These current metrics will serve as a benchmark of your current state. Frequently, companies will perform initial research activities, like surveys or user tests, for each project to help them form a baseline.
However it’s done, the key here is to get an idea of where you stand before a specific effort shifts into high gear and changes are rolled out to end users.
Convert Once you’ve captured your current measurements, take those UX Metrics and start running them through a series of conversions to turn your UX metrics into business KPIs.
This is more of an art than a science, so you’ll need to adjust your approach based on the metrics you’ve chosen and the business KPIs you’re attaching them to.
Calculate Calculating your ROI involves very simple math, using the following formulas:
ROI = Return/Investment
Remember, your “return” may vary based on the metrics you define in steps 1 and 2. It’s also possible to identify the percentage increase or decrease in your KPI using:
Percent Change = (New Metric-Old Metric)/Old Metric
Pulling it all together
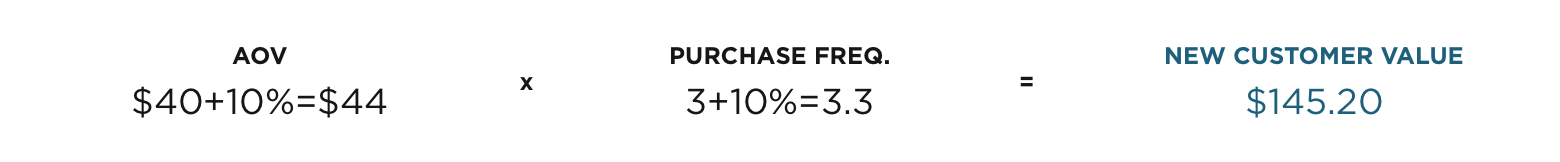
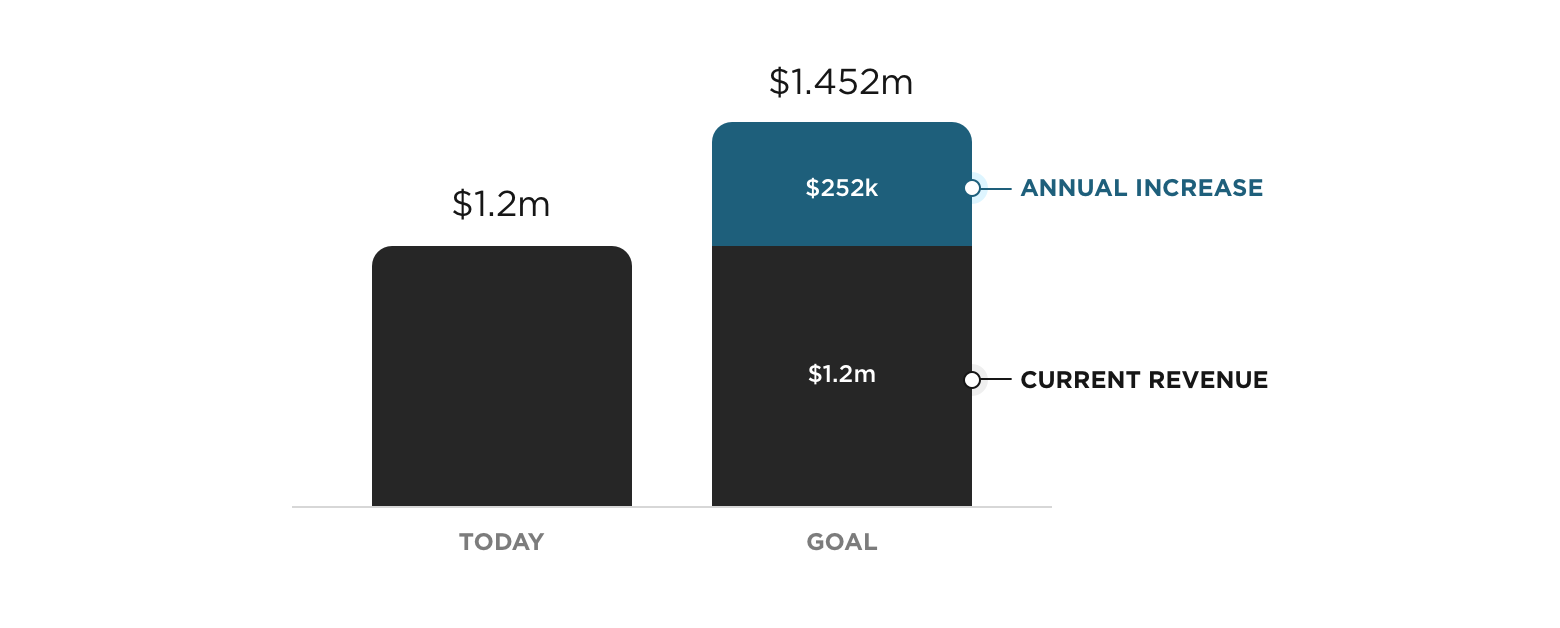
Let’s walk through a real world example. Assume we sell a product for $40, and the average customer buys from us 3 times per year. Today, that customer’s current value is $120 per year.

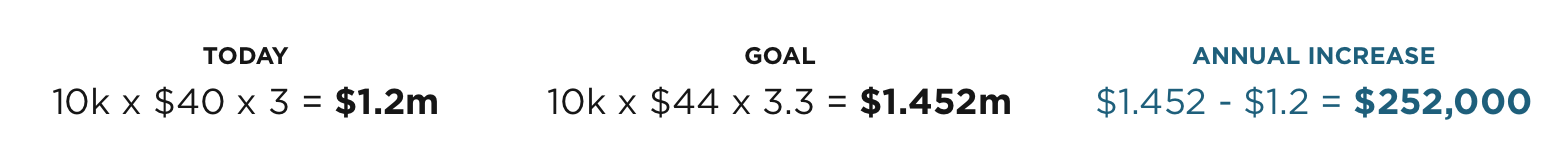
Senior leadership would like to improve the value we create for each customer, where they would feel inclined to spend more with us (Increase Average Revenue Per User ARPU). We believe understanding what customers want from user research and usability testing will allow us to make product and website improvements that will increase the average order value (AOV) by 10% to $44 ($40+10%=$44), and order frequency by 10% to 3.3 per year (3+10%=3.3).
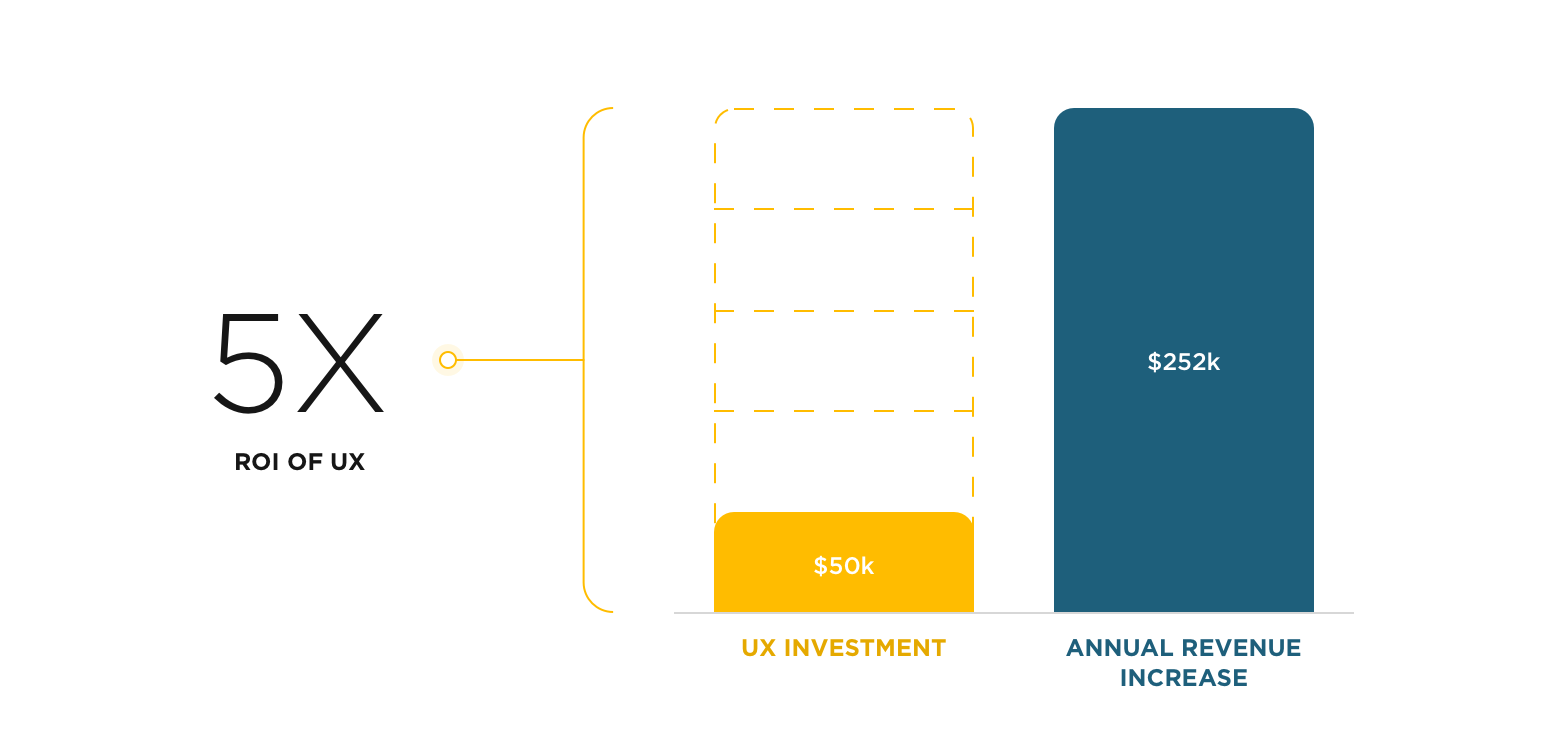
Let’s assume in this example that our company has 10,000 customers, that’s a revenue improvement of $252,000… for just one year!
We can easily calculate the short-term ROI of a UX research and design project by dividing the new revenue by the cost of the project. In our scenario, let’s put the total UX investment at $50k.
Determining the ROI of UX isn’t always part of a UX team’s process, but it’s the best way to quantify your team’s contribution, identify what’s working within your UX practices, and prove the overall value of UX within your company. It will also help quantify your design investments to determine where to double-down and where to cut losses.
At Drawbackwards, we calculate the ROI of UX for every client project, and we’ve even created tools to set a benchmark for a customer’s experience and then measure the quality of UX improvements over time.
The ROI of UX is well-documented for some of the best organizations in the world, and yours can do the same by speaking the language of the business, being SMART about your targets, and by keeping score.